How-To: Basic Fits with GUI
Setting Up
Single-Site Model
For performing a single-site model fit to a single experiment.
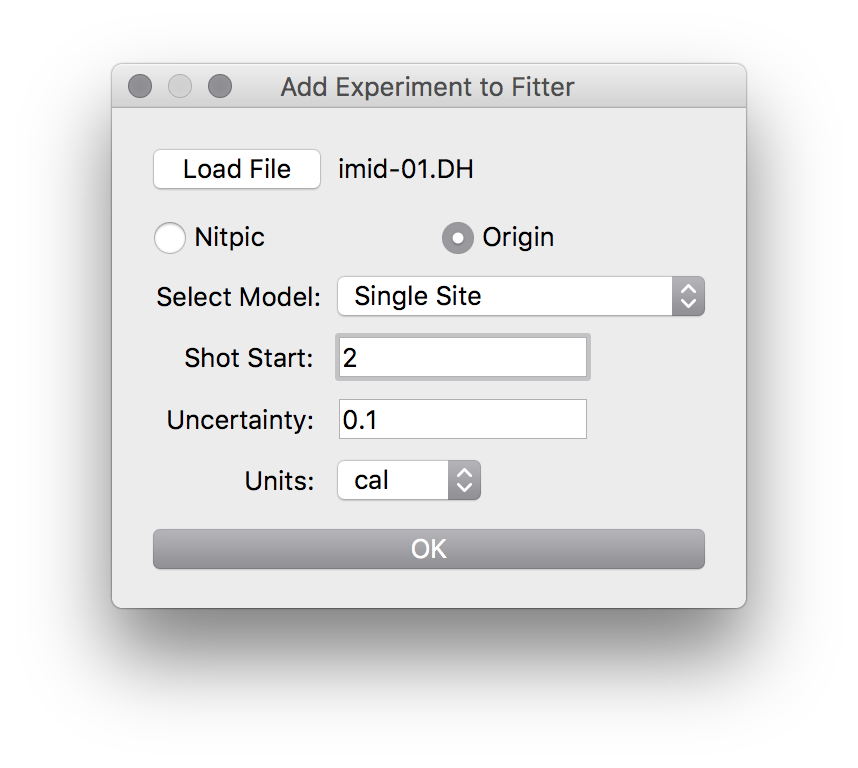
First, go to File -> Add Experiment. Select the model, load in the
file, and select the shot start.
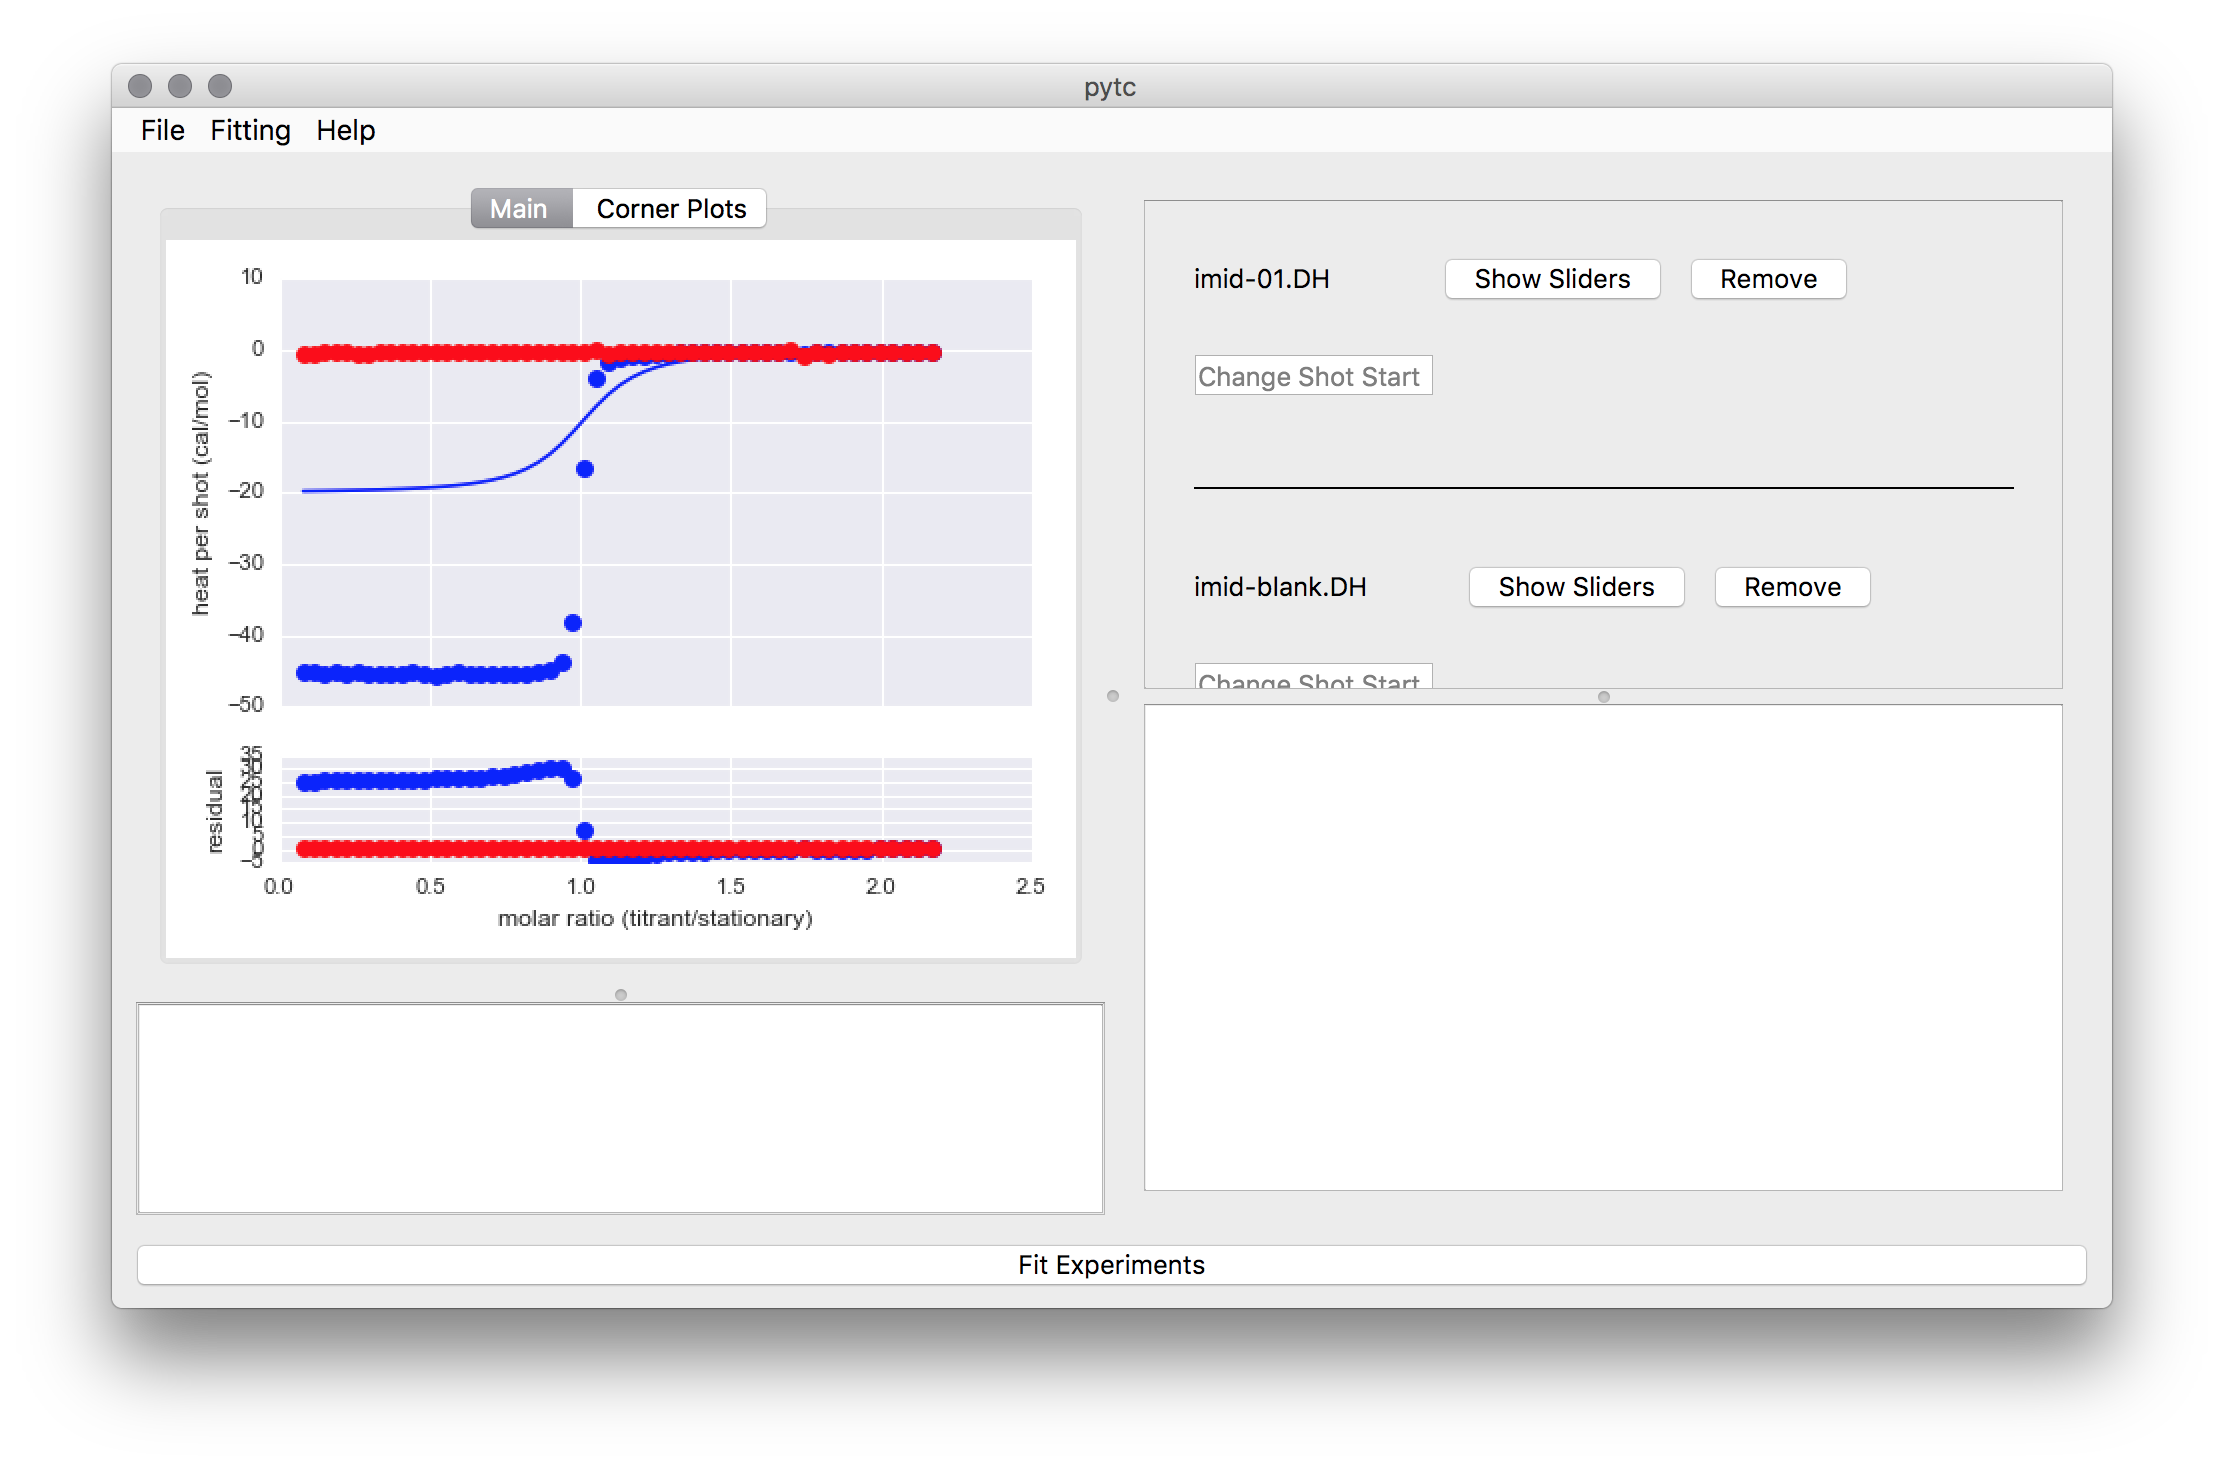
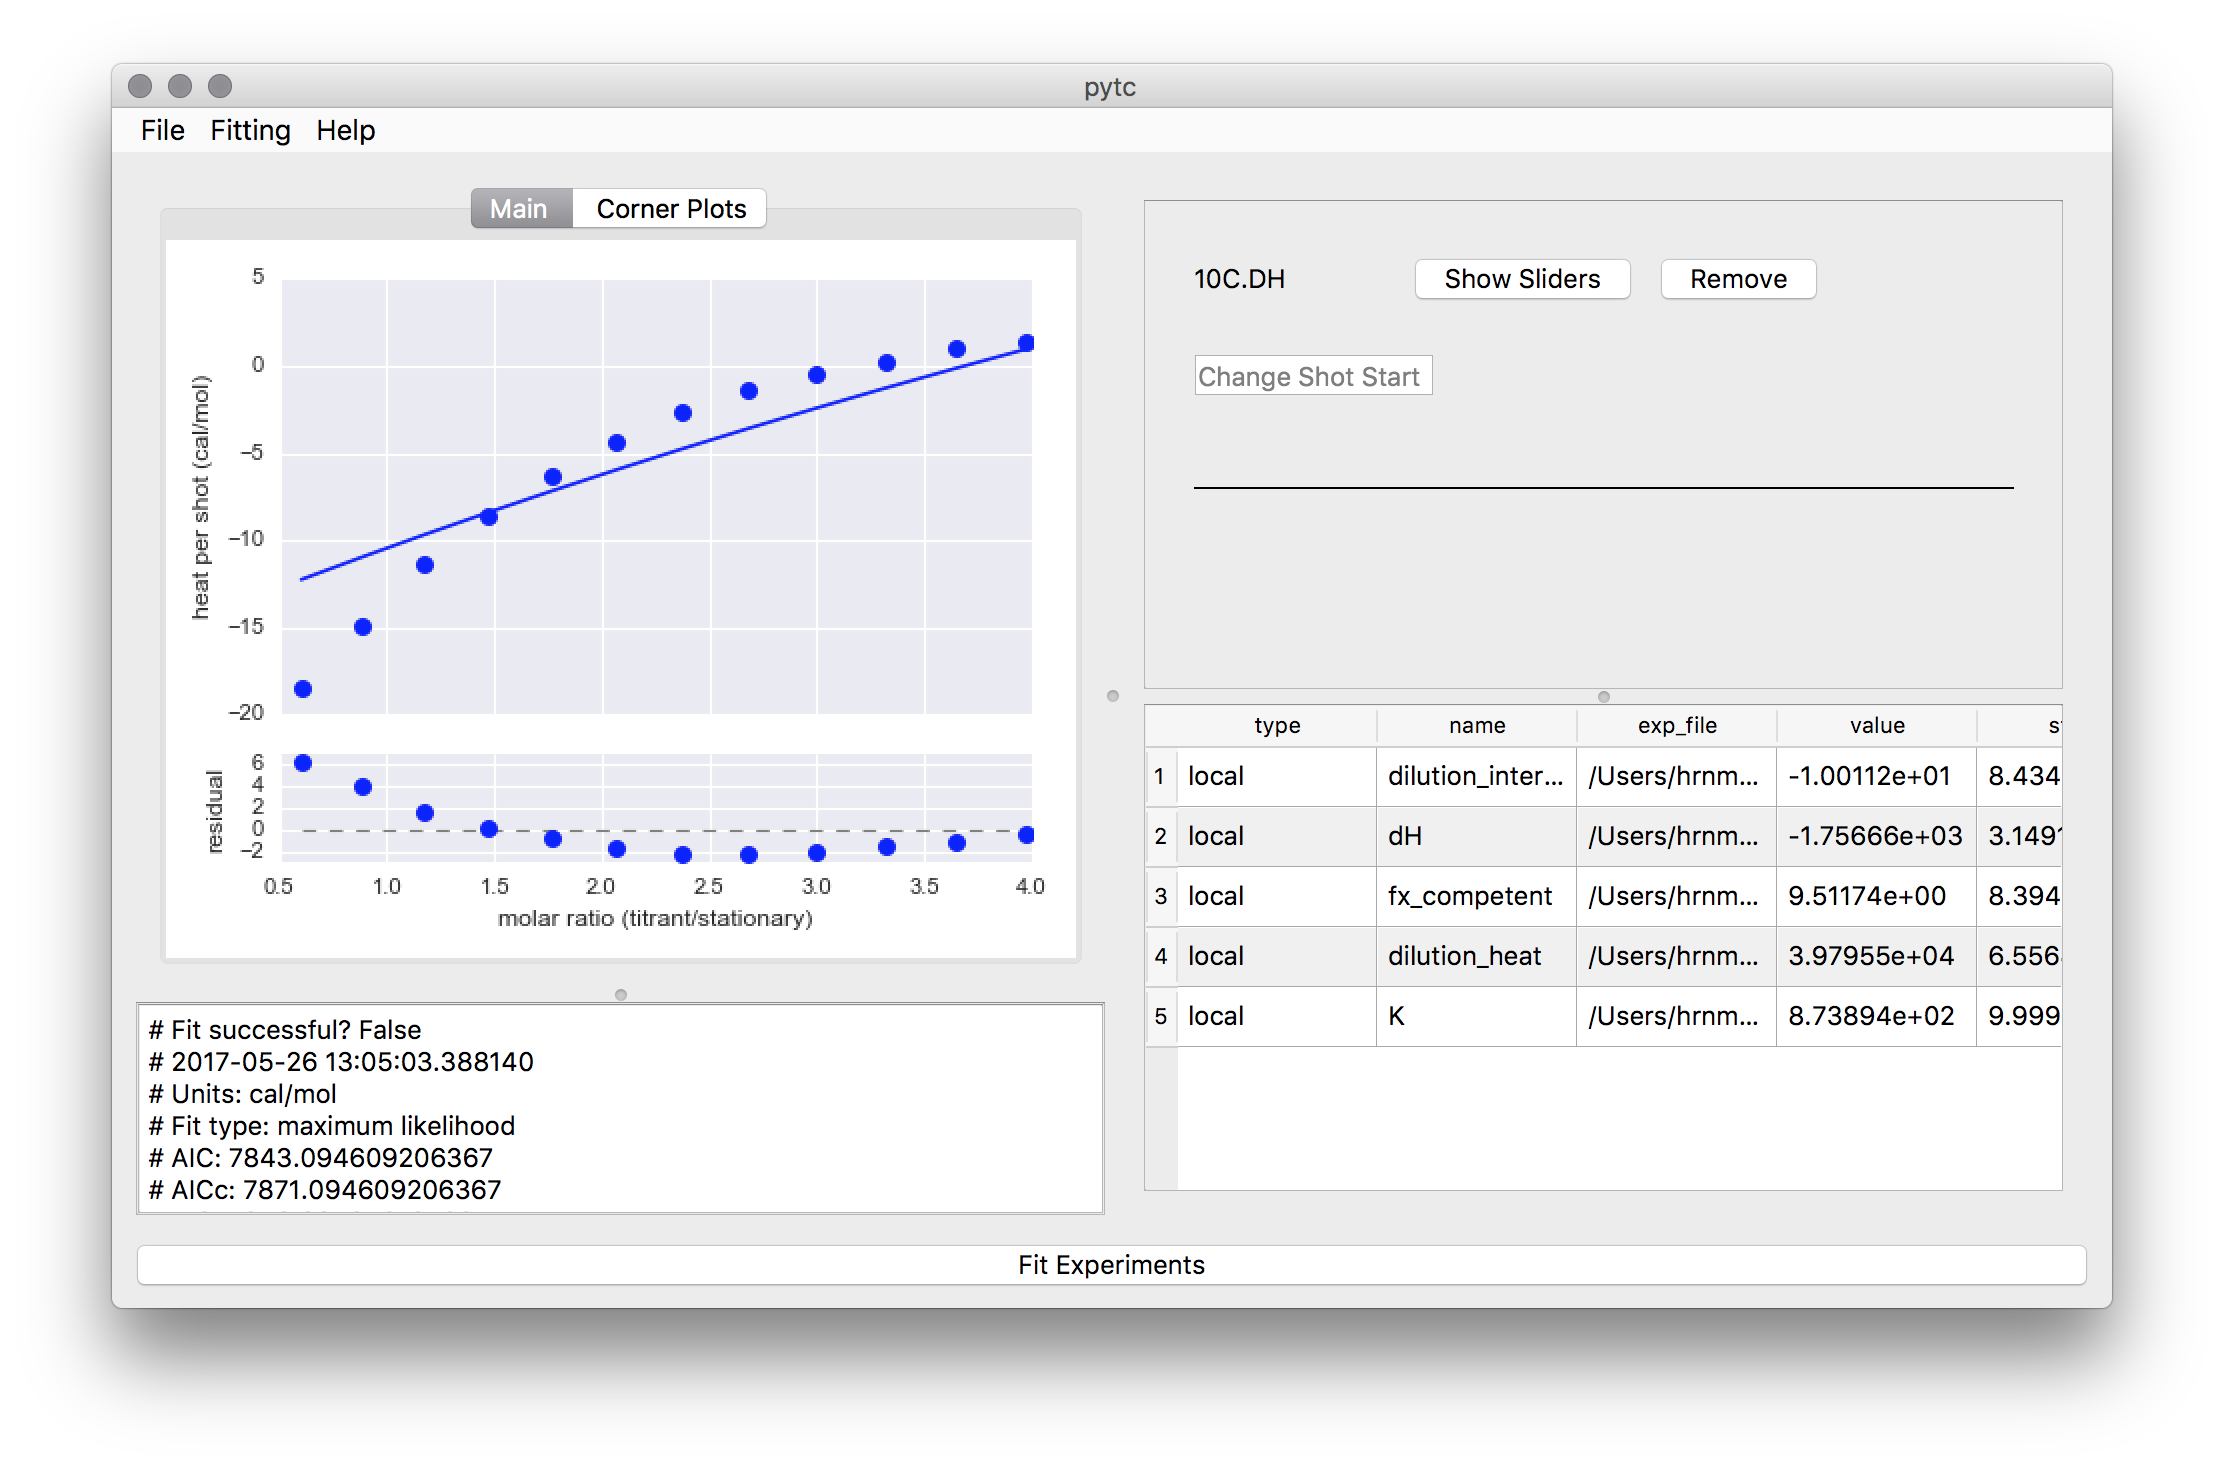
Before fitting, the graph shows the model calculated using the parameter guesses.
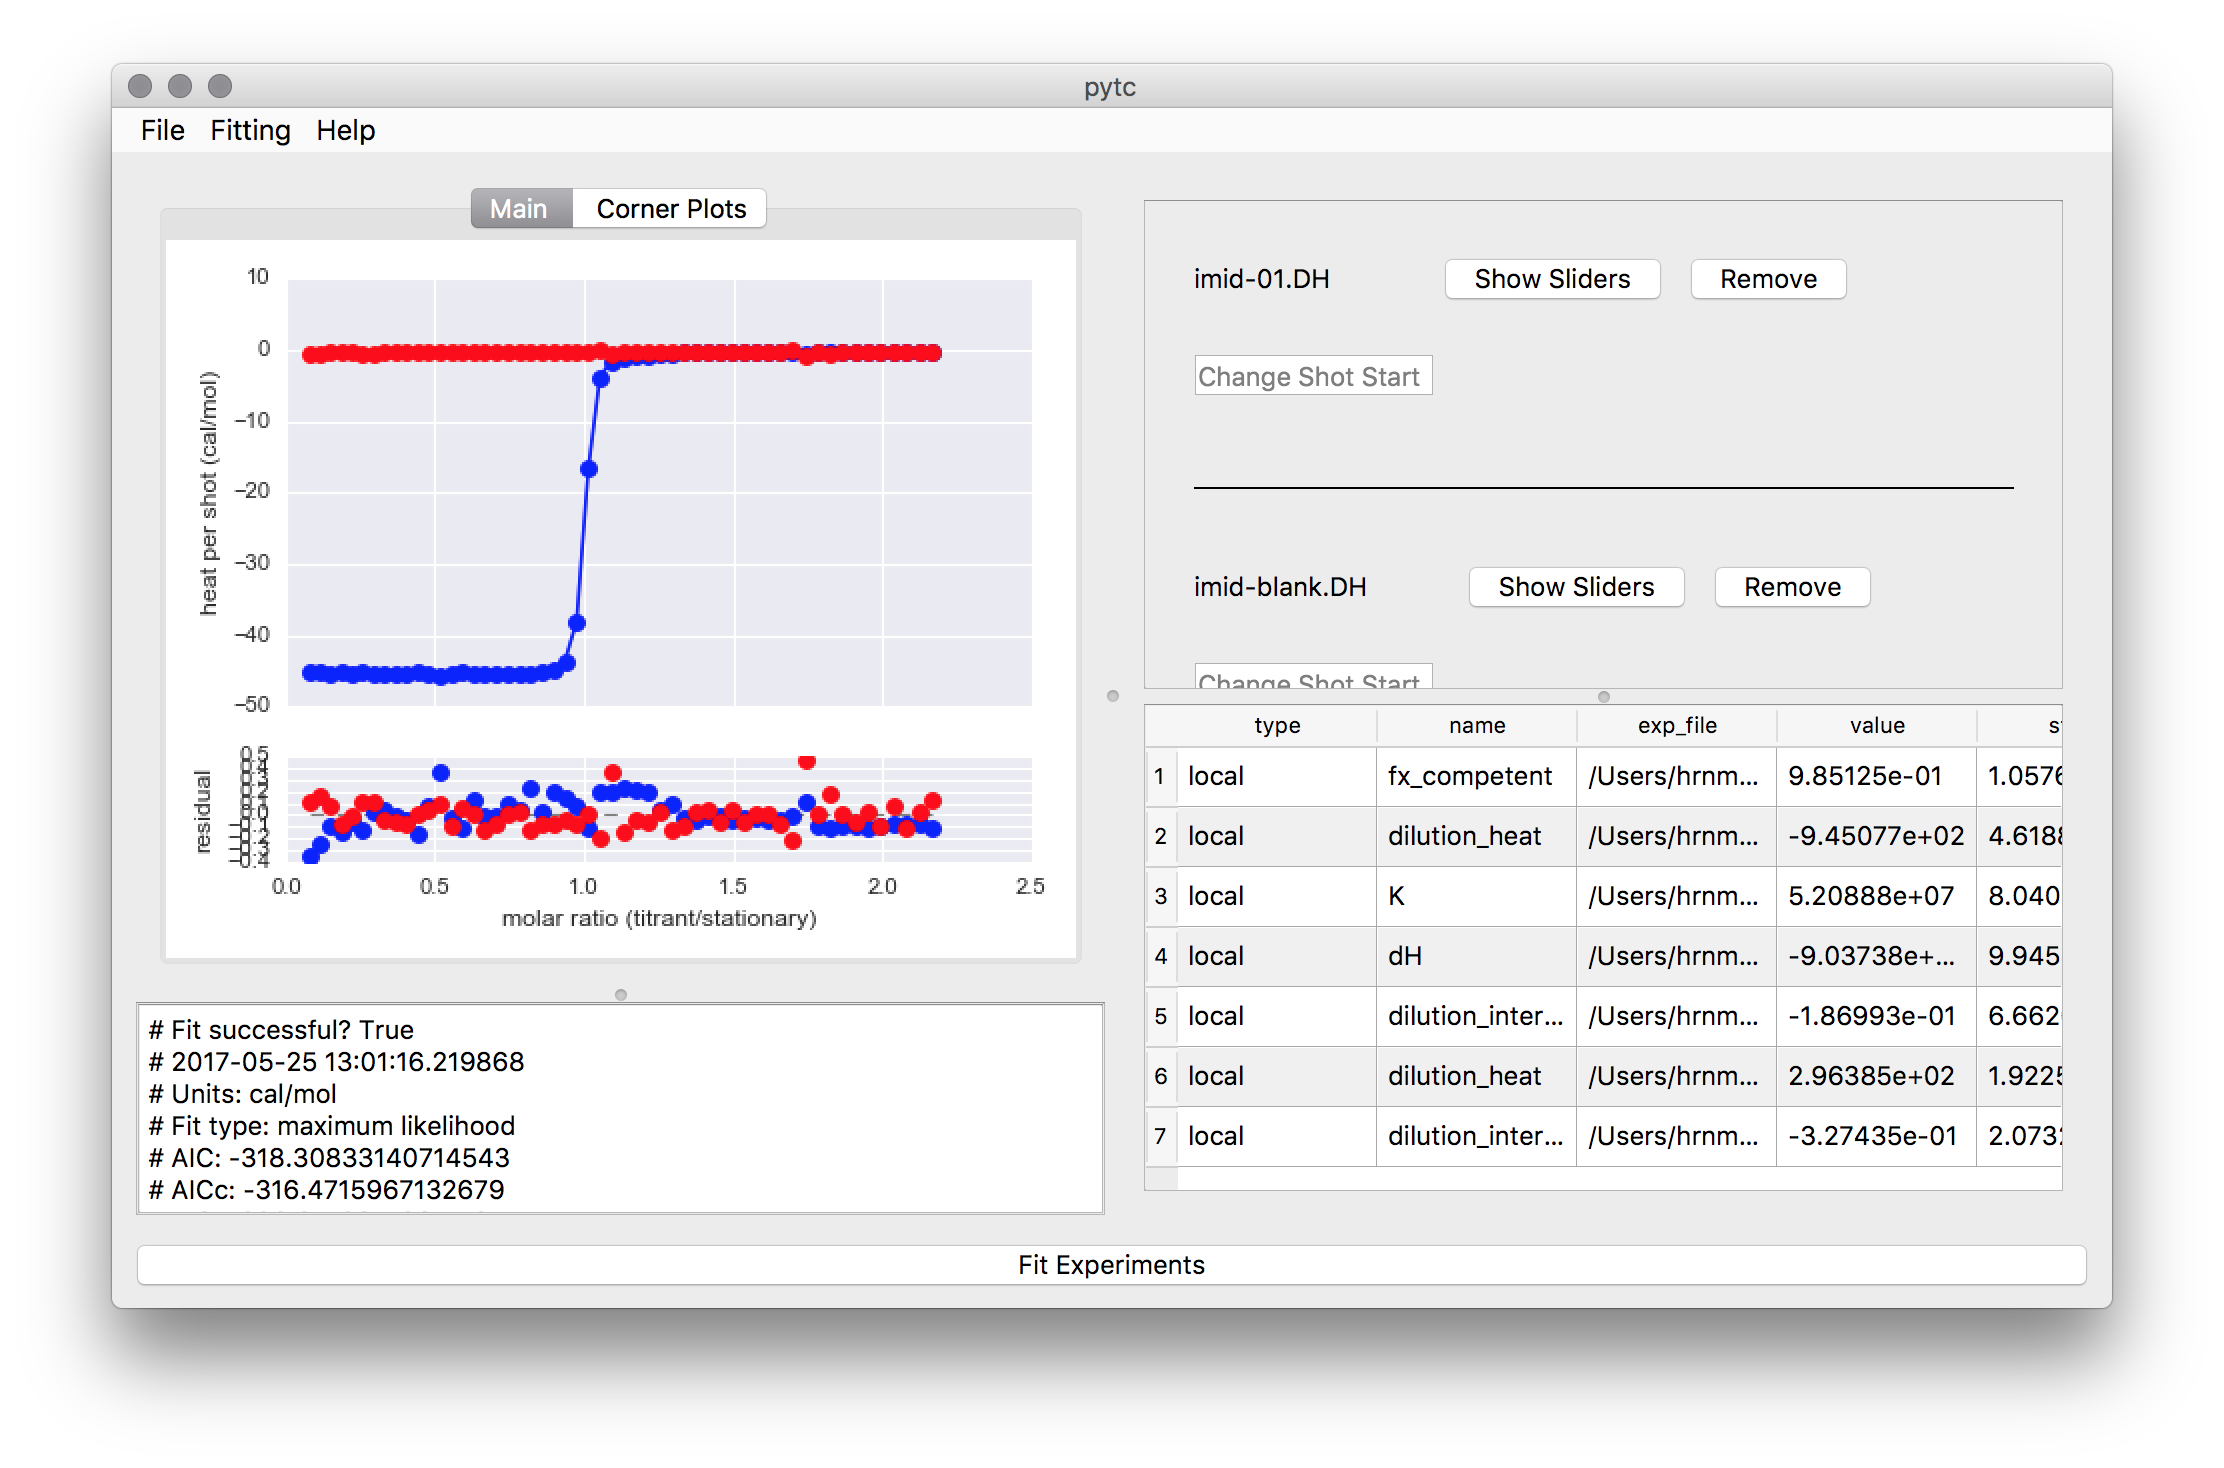
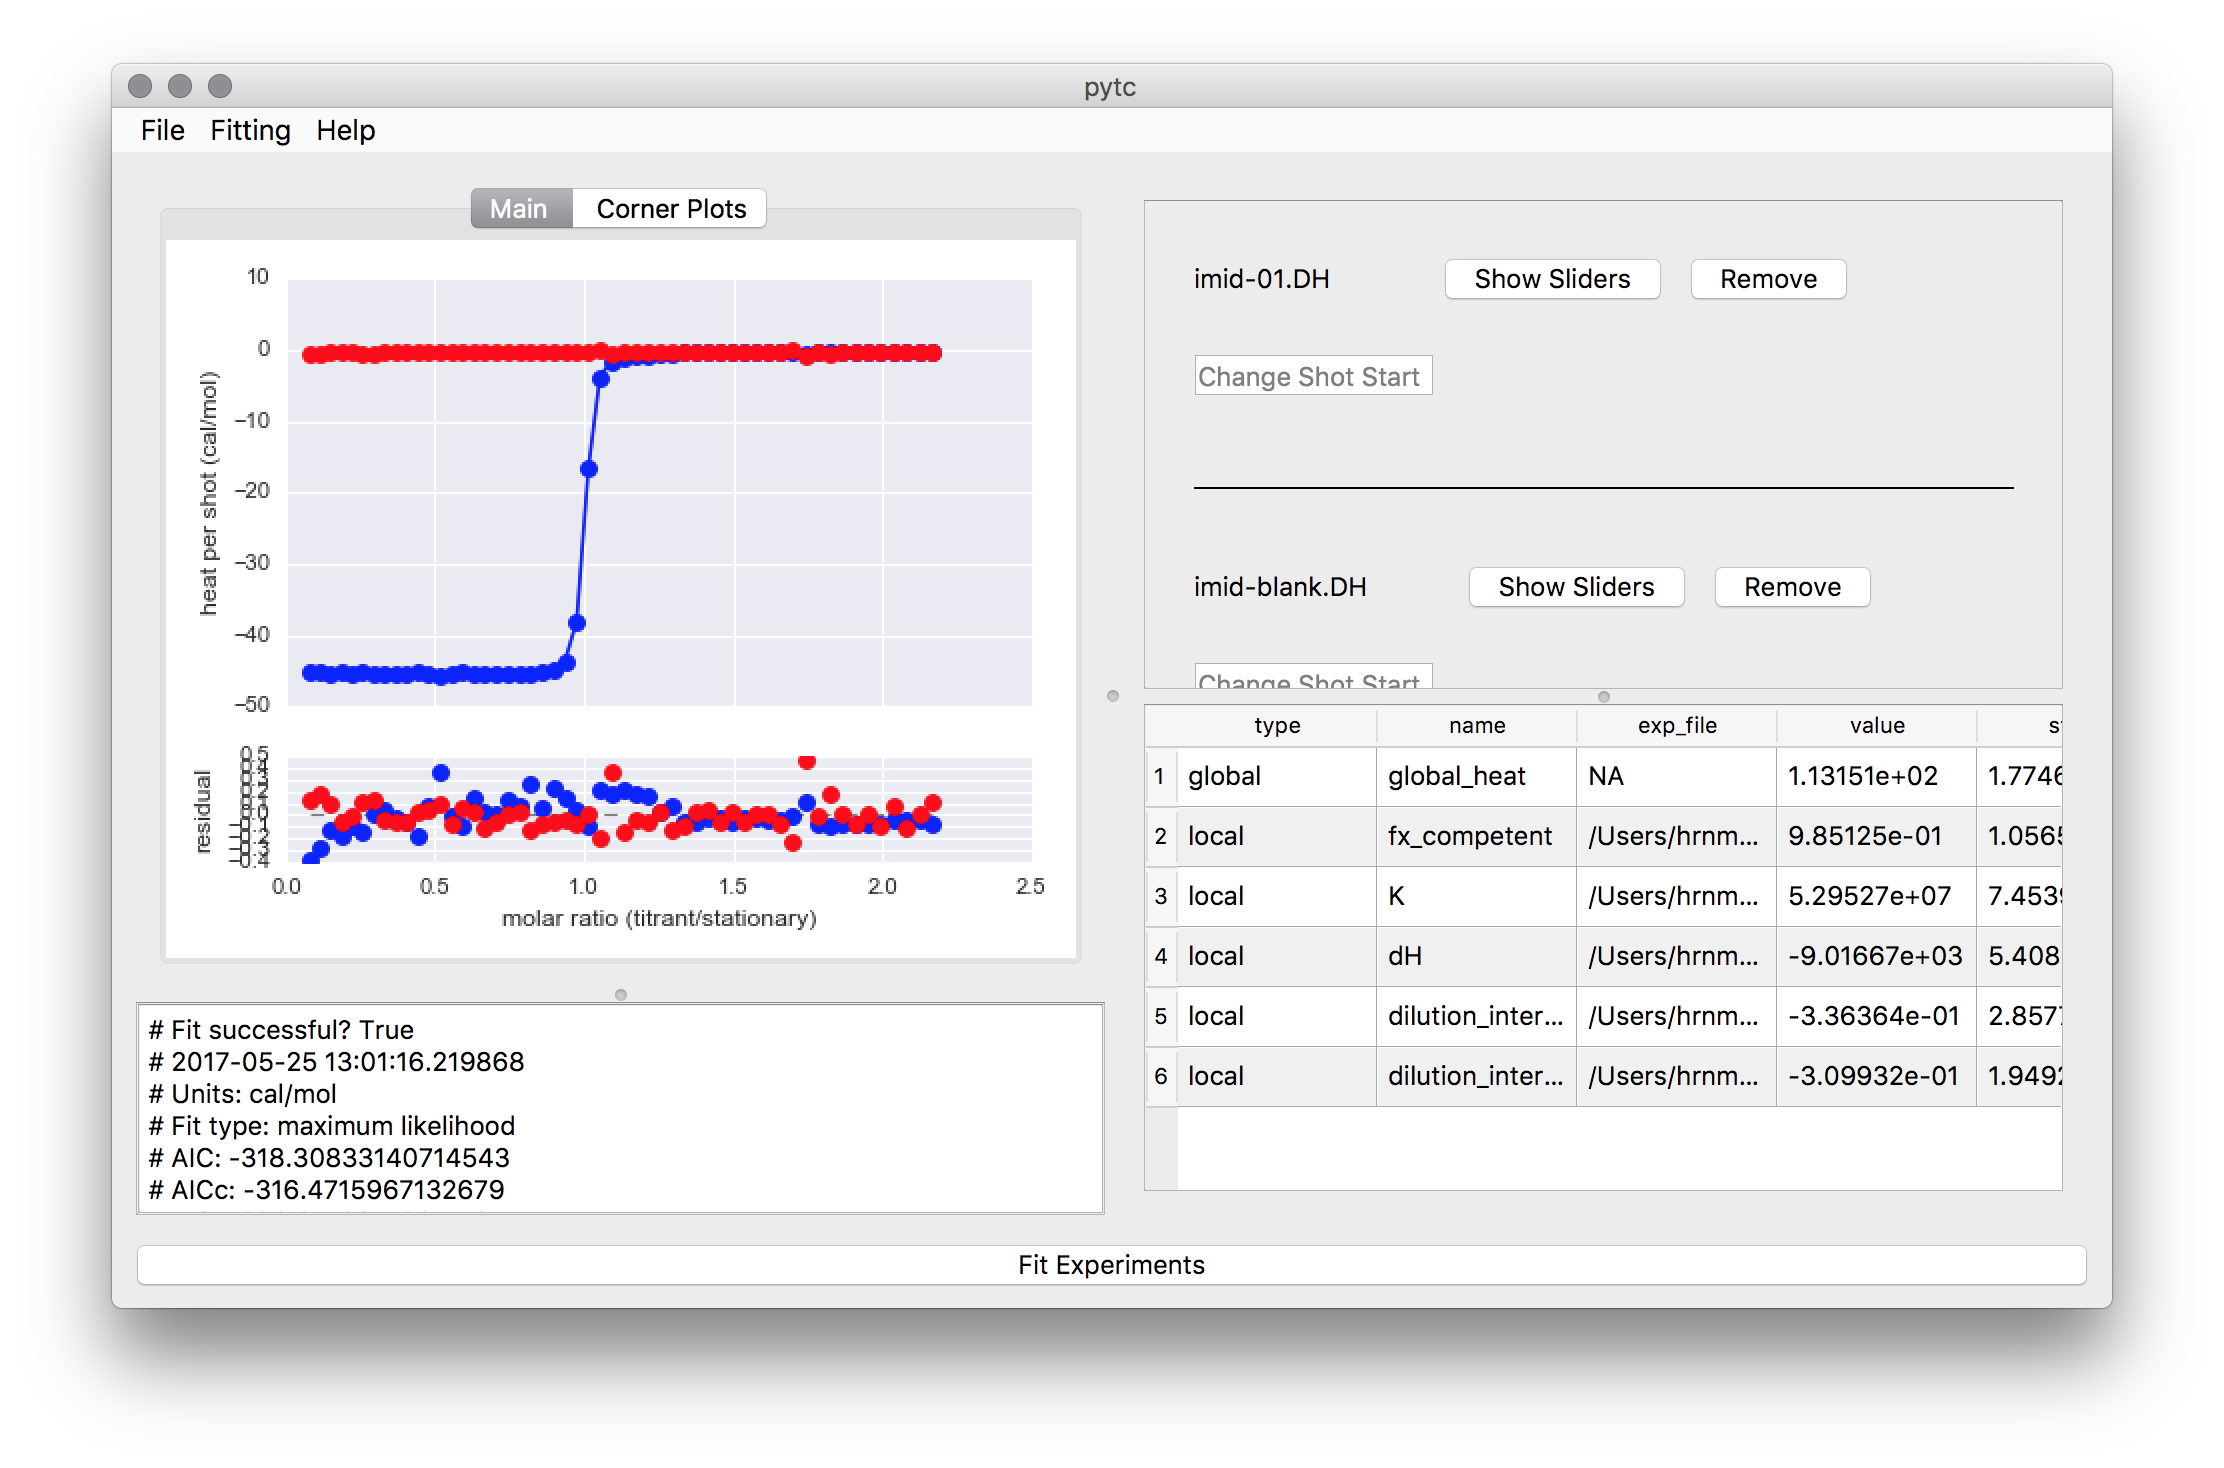
To fit the model, go to Fitting -> Fit Experiments.
This can be repeated for more experiments. Any new experiments you load will be added to the GUI.
Sliders
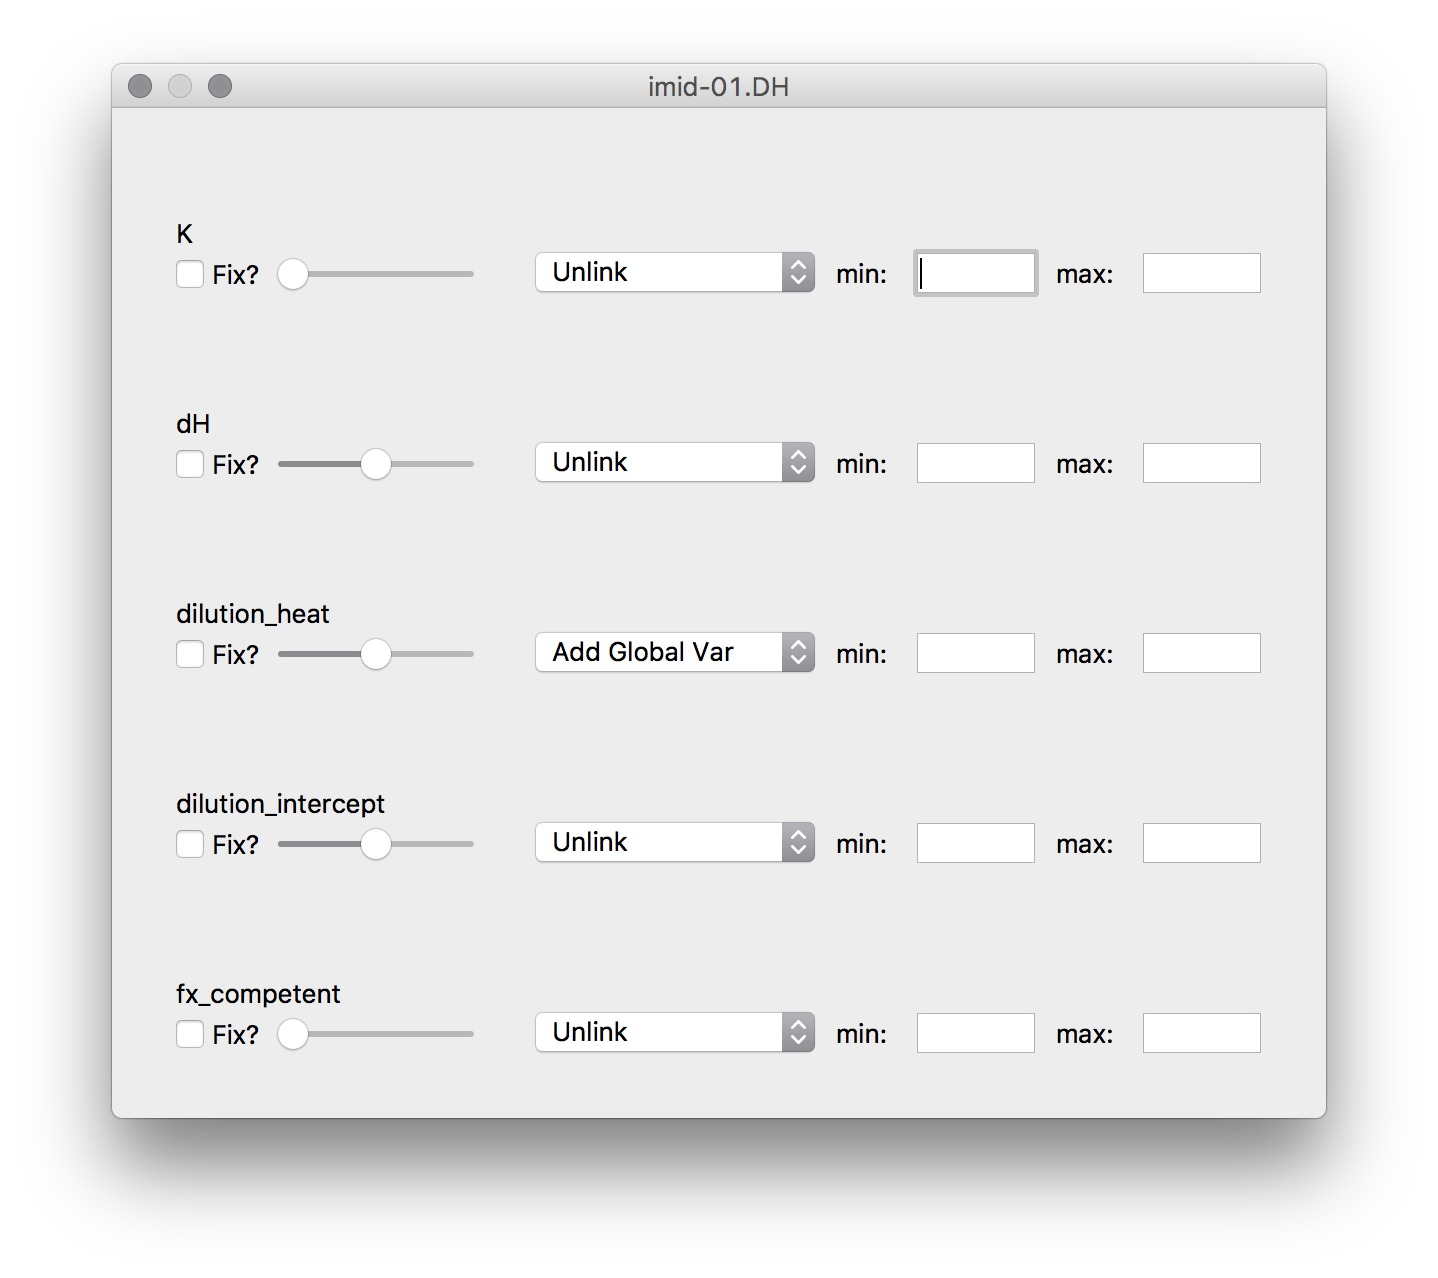
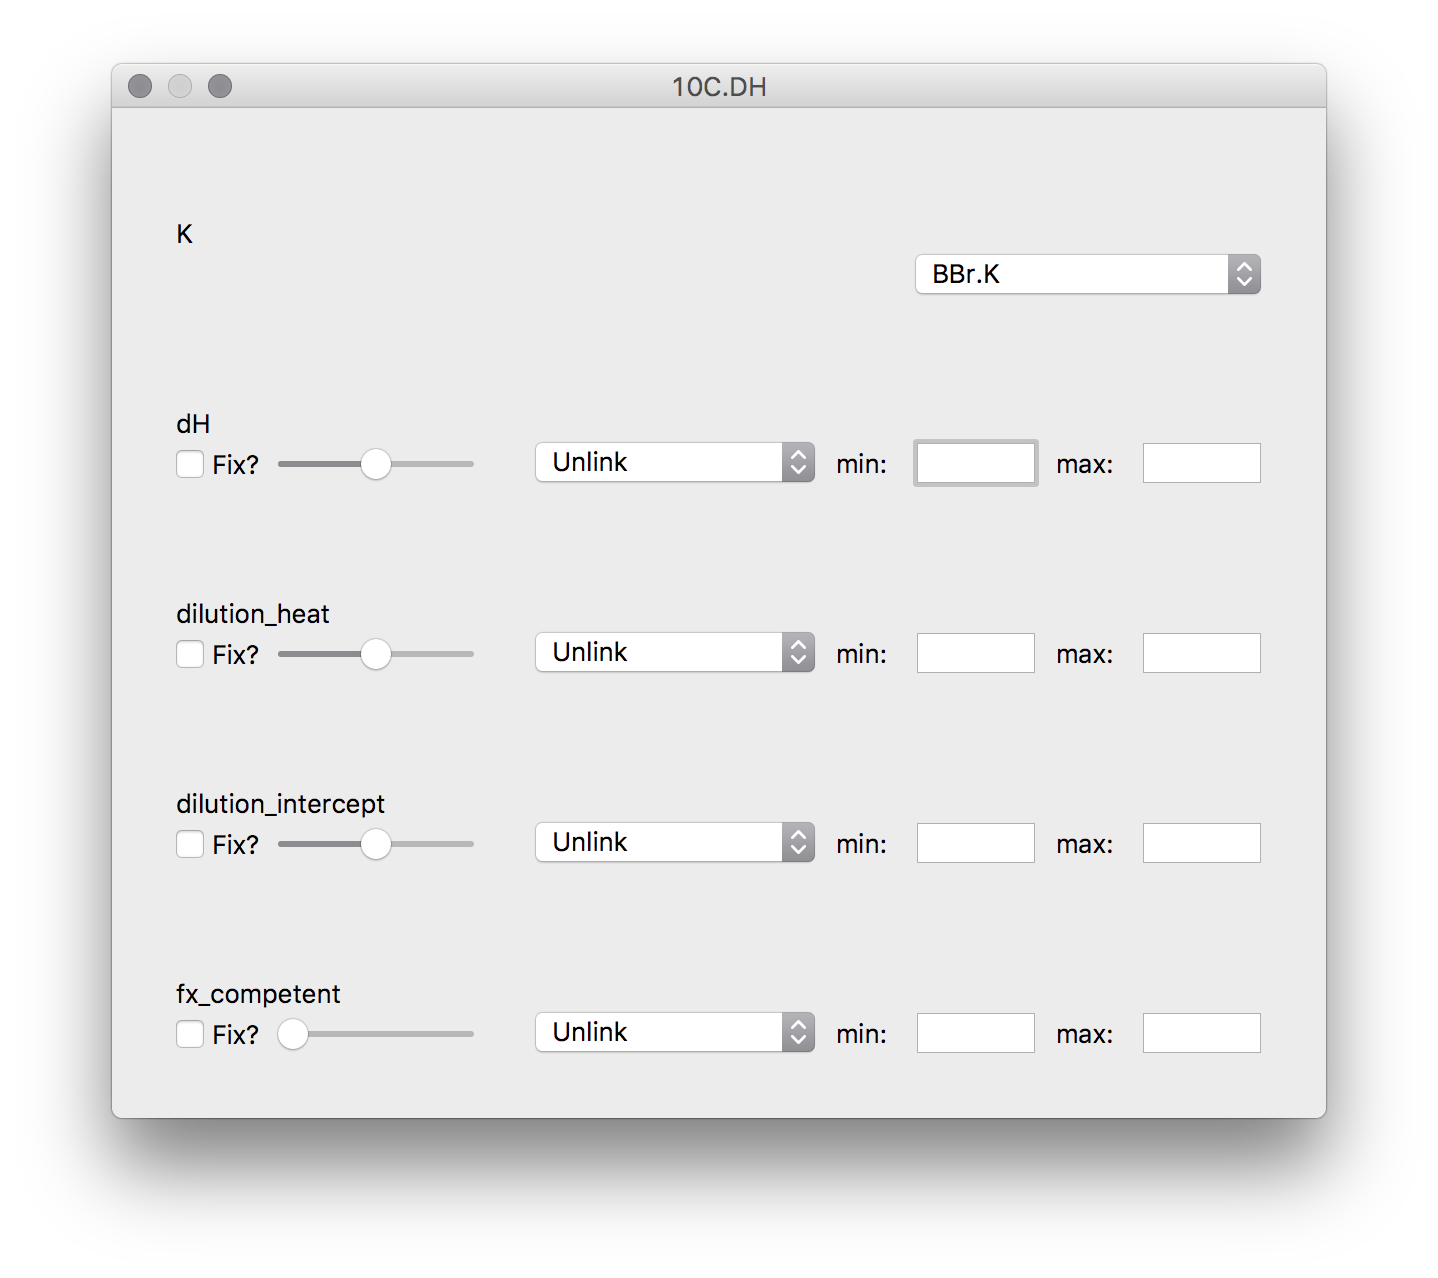
Each loaded experiment has a model with associated fit parameters. These parameters can be maniuplated using a set of “sliders”. These have the same general layout. Each time a value is changed on a slider, the graph is updated with the new guesses. The graph will update to show the fit results once the fit is performed.
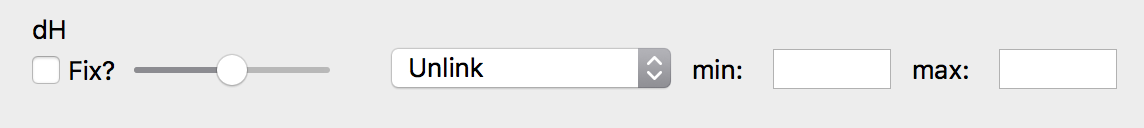
The general layout for each slider. Global parameters are similar except they exclude the dropdown menu.
| Use | |
|---|---|
| Fix | When checked, allows you to enter a fixed parameter value |
| Slider | Changes the parameter guess value. |
| Dropdown | Allows you to link and unlink parameters from global
parameters as well as creation of new global parameters or
connectors.
|
| Min/Max | Allows you to change the bounds of allowed values for a
parameter.
|
Global Variables
Simple Global
For using a global variable that is shared across multiple experiments.
pytc-gui uses sliders to select guesses for each fit parameter. To
get to the sliders for an experiment, click on the Show Sliders button
next to the experiment name. Each pop-up has the same basic layout.
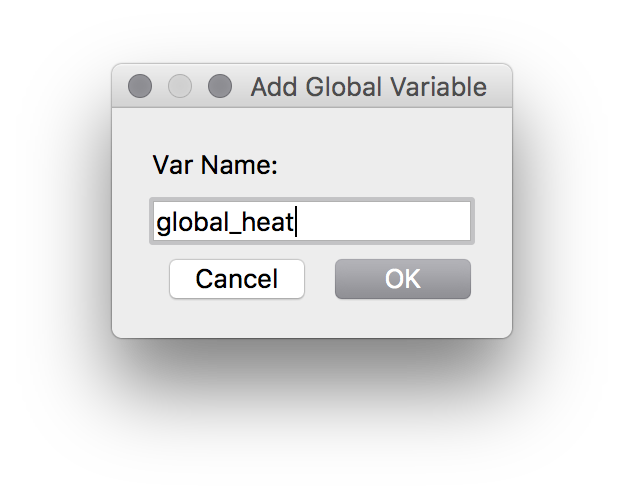
The pop-up allows you to create a new global variable.
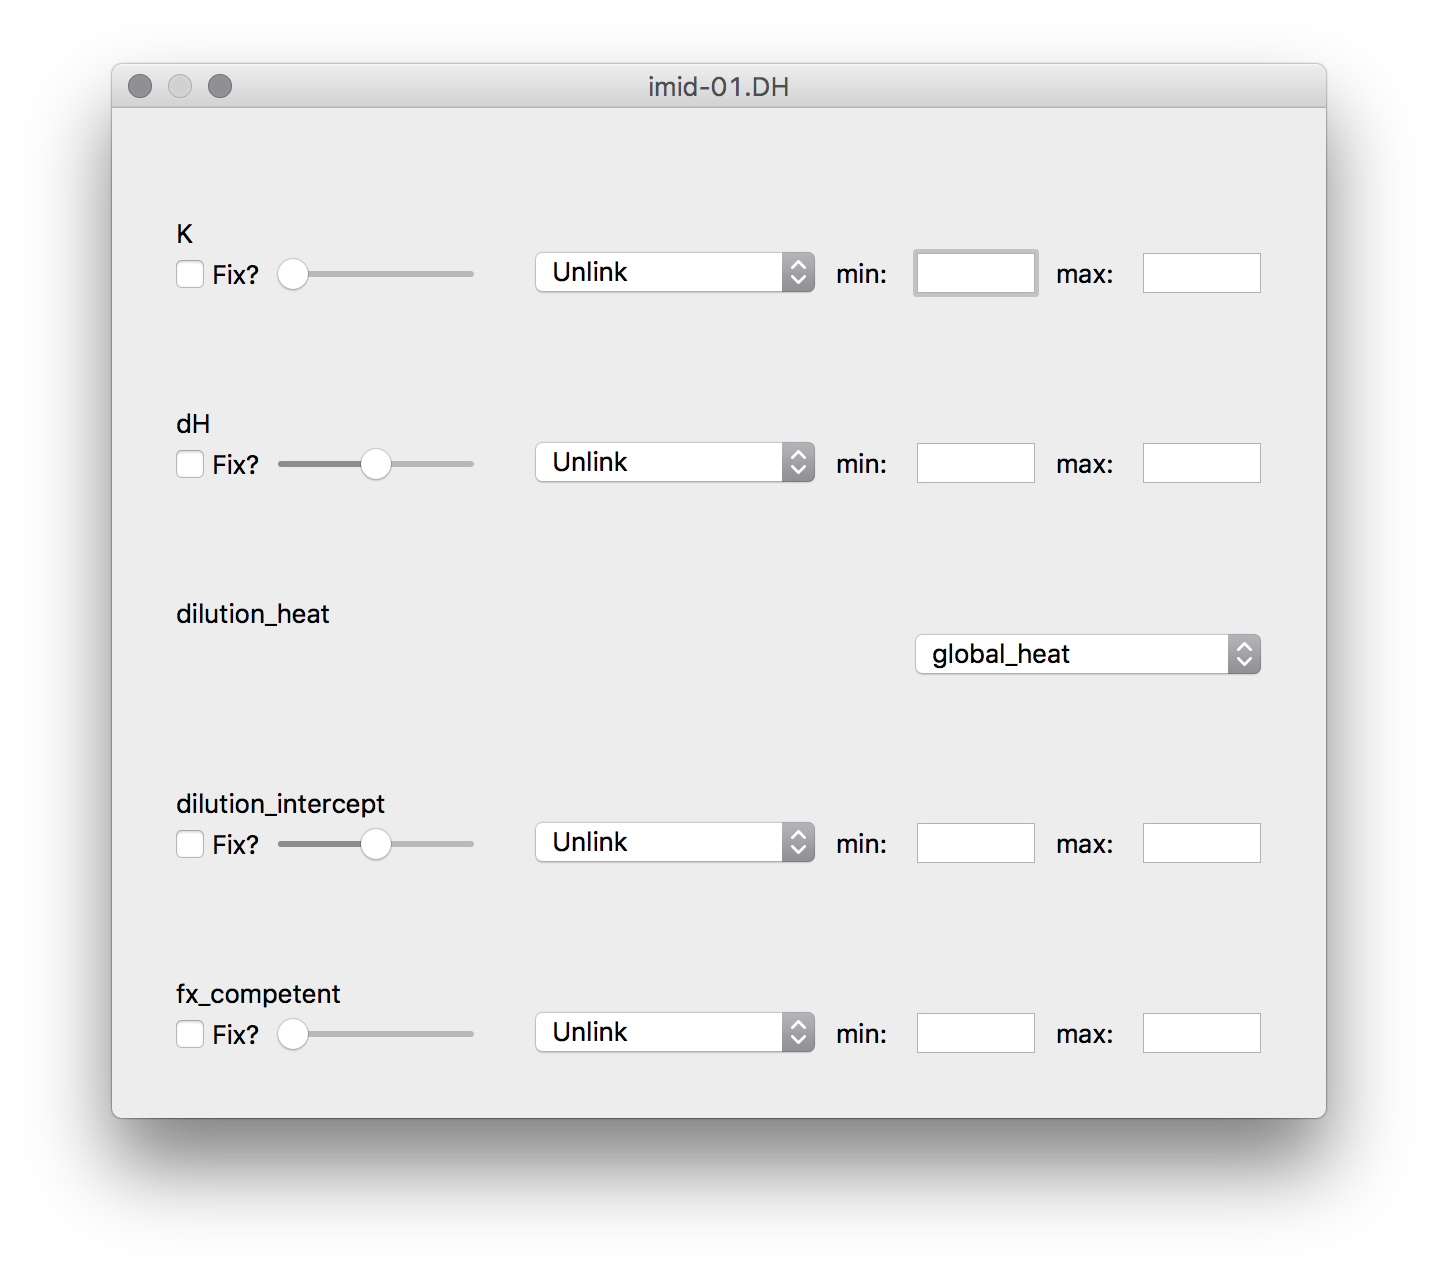
Once a global variable is made, it can be linked to any parameter by selecting it from the dropdown menu for that parameter.
A new entry is made for the global variable. After this select
Fitting -> Fit Experiments. This will fit the new global model to
the data an update the graph and parameter list.
Connectors
For defining more complex linkages between experiments (such as a van’t Hoff relationship).
Fit using a temperature dependant experiment.
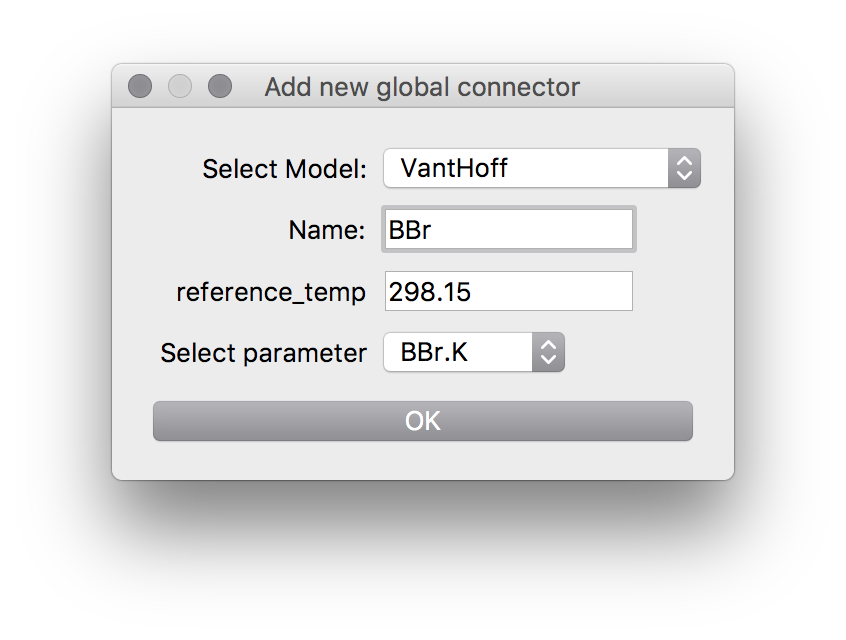
Connectors are linked in a similar way to global variables, except select Add Connector from the dropdown menu rather than Add Global Var. A new pop-up will come up allowing you to select the type of connector you’d like to make, the name of the connector, and nay variables linked to that connector.
As with global variables, link parameters to a connector parameter by selecting the connector from the dropdown menu.

Some connectors might require experimental metadata (temperature, ionization enthalpy, etc.). These need to be defined before performing the new fit.
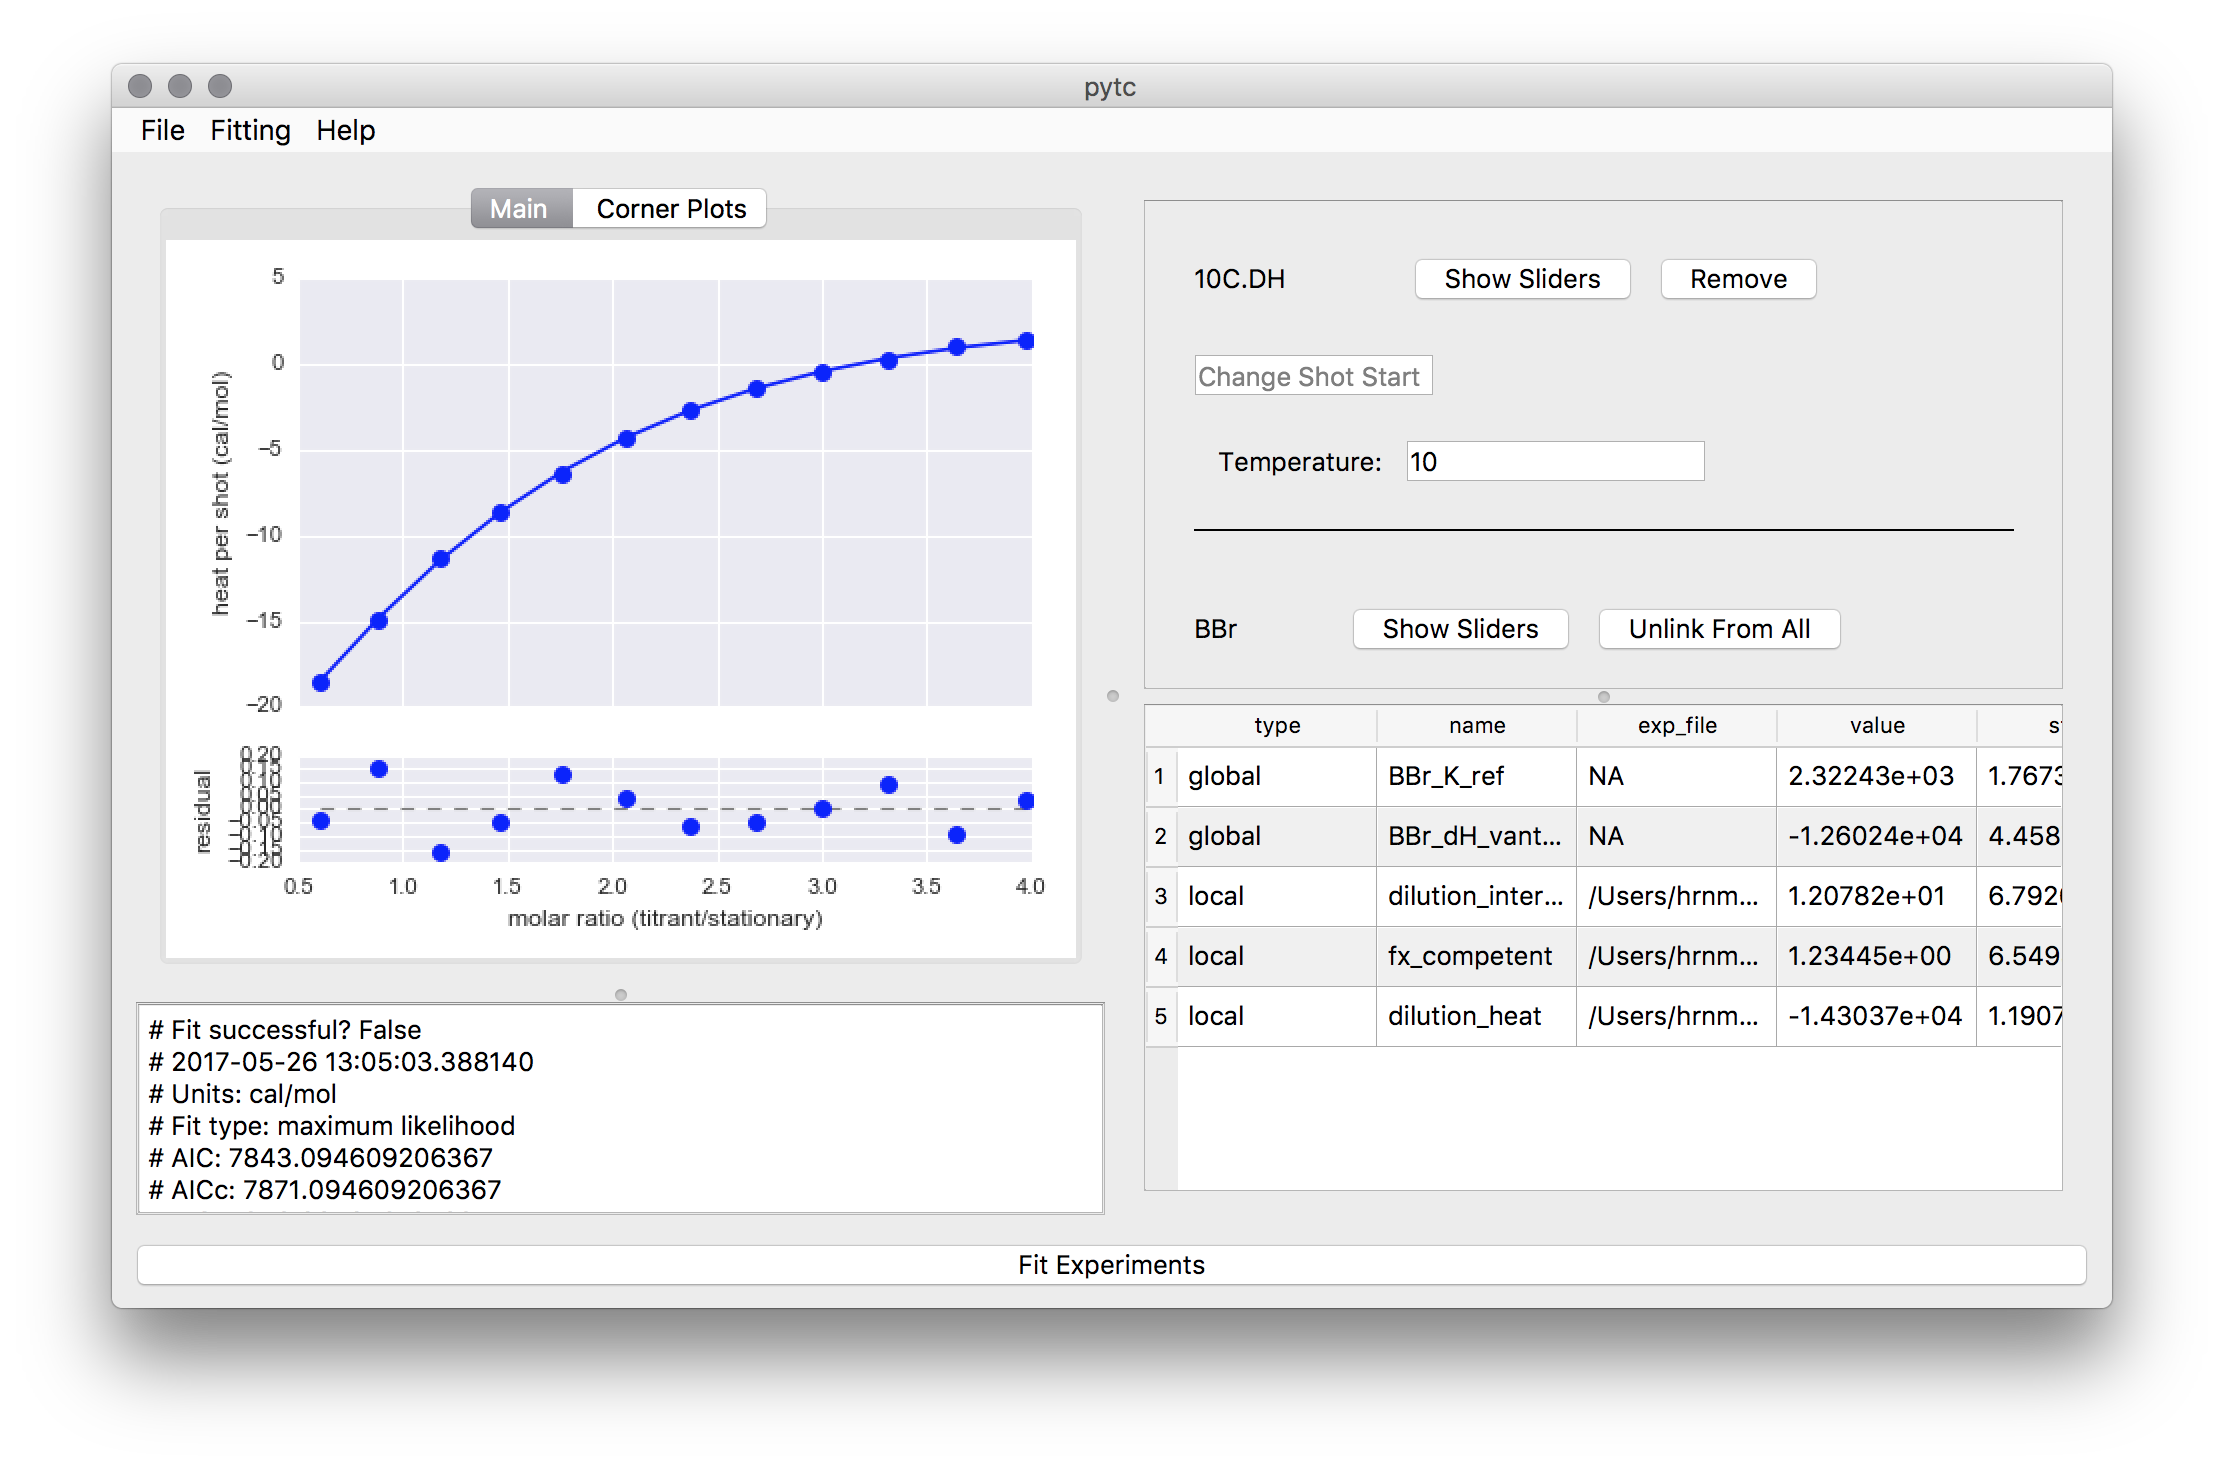
Once everything is set, perform the new fit.